GAAS - Screenshots

GAAS logon windows
Both Assembler and Analyzer software are provided with user access control. This enables storing specific user settings and analysis results independently and privately for each user in a multi-user environment.
Assembler logon window Analizer logon window

Main Gene Array Assembler Software window

This 
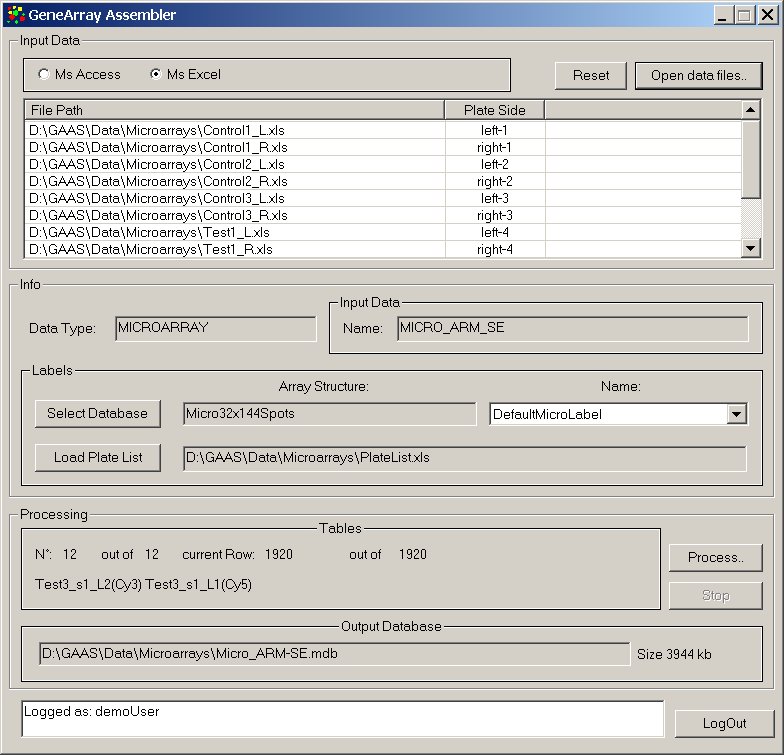
window constitutes the user interface for input data format standardization.
MS-Access or MS-Excel files containing the input data are loaded and their structure is compared with the data structures defined in the input data templates stored in MasterDB, the GAAS system database. If an equal structure is found, the correspondent transformation schema type is associated to the input data.
A MS-Access database containing array structure labels of the input data must be loaded. Such labels allow identifying each spot in the array structure and associating input expression data to array spotted clones through gene identifiers (e.g. GenBank accession number, Clone ID, UniGene ID, gene description).
Transformed input data are stored in a standard MS-Access data format used during expression analyses.
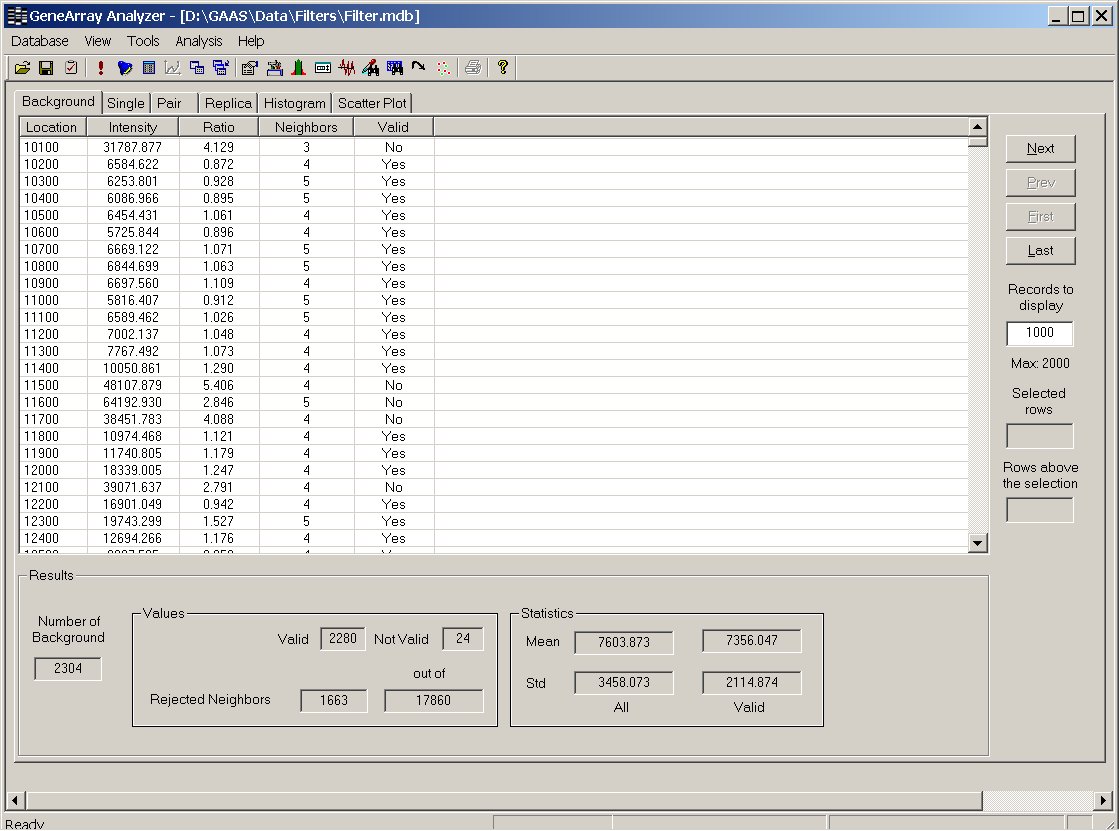
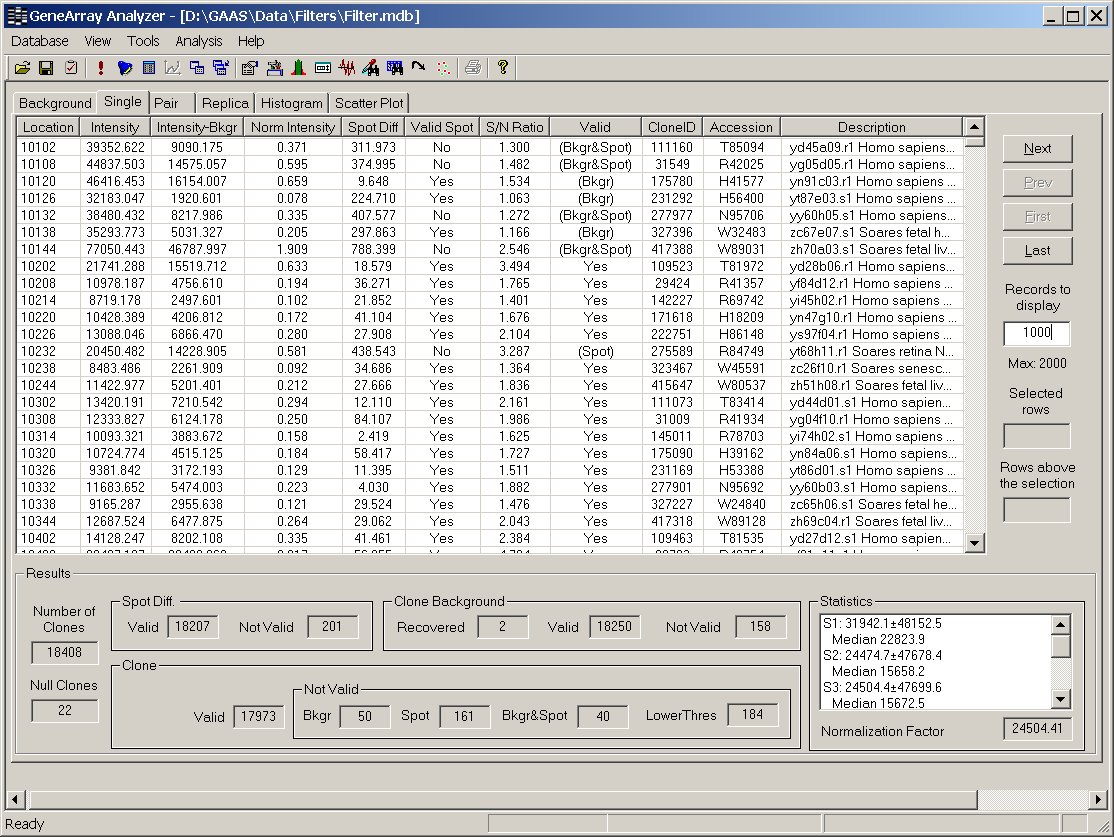
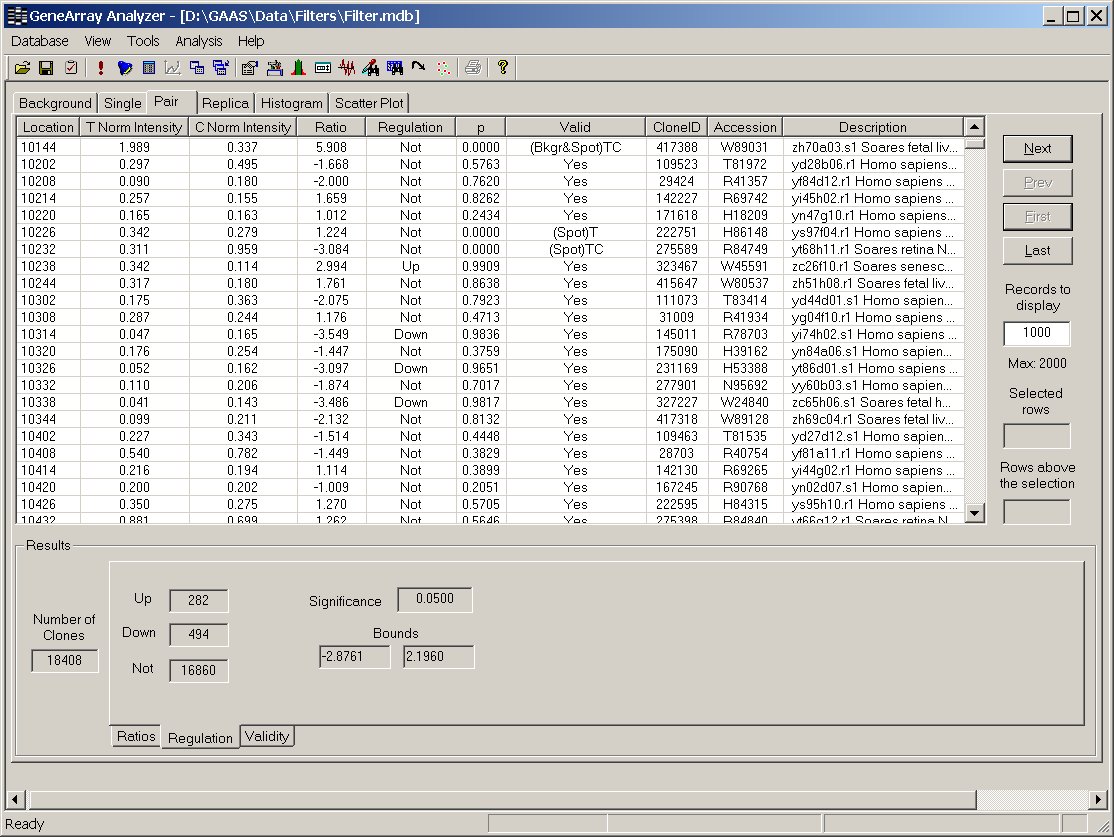
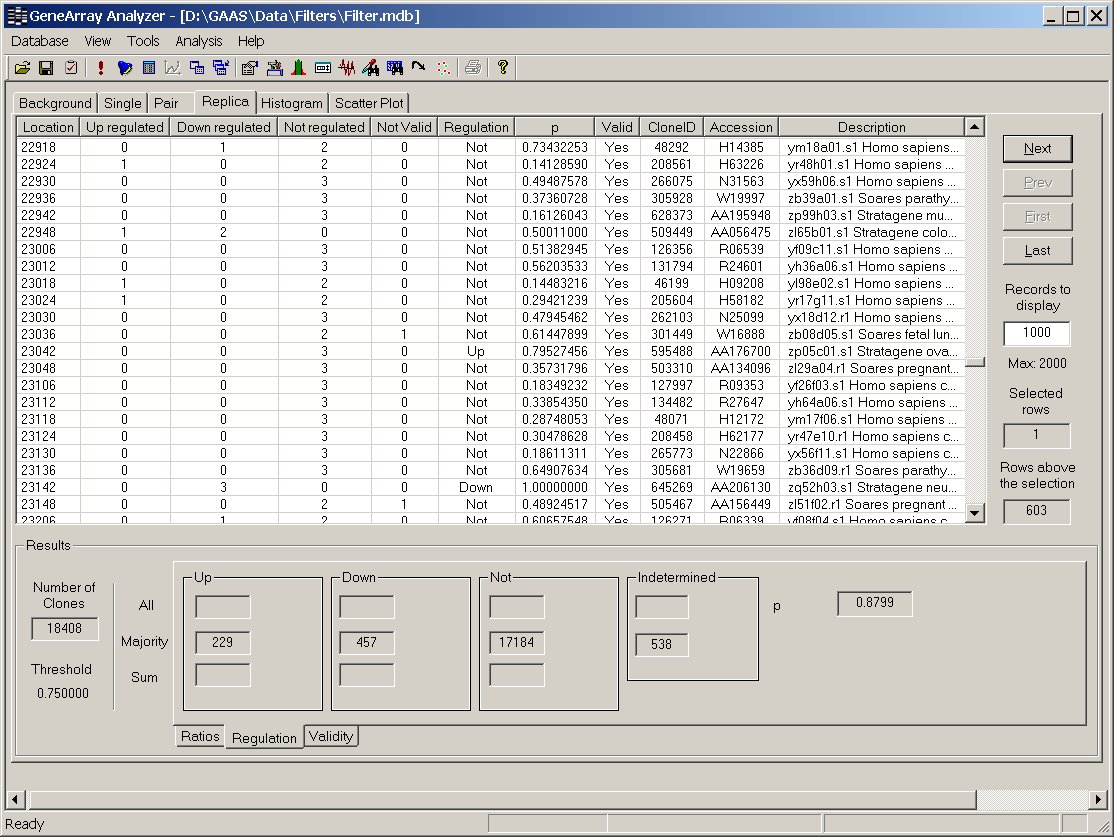
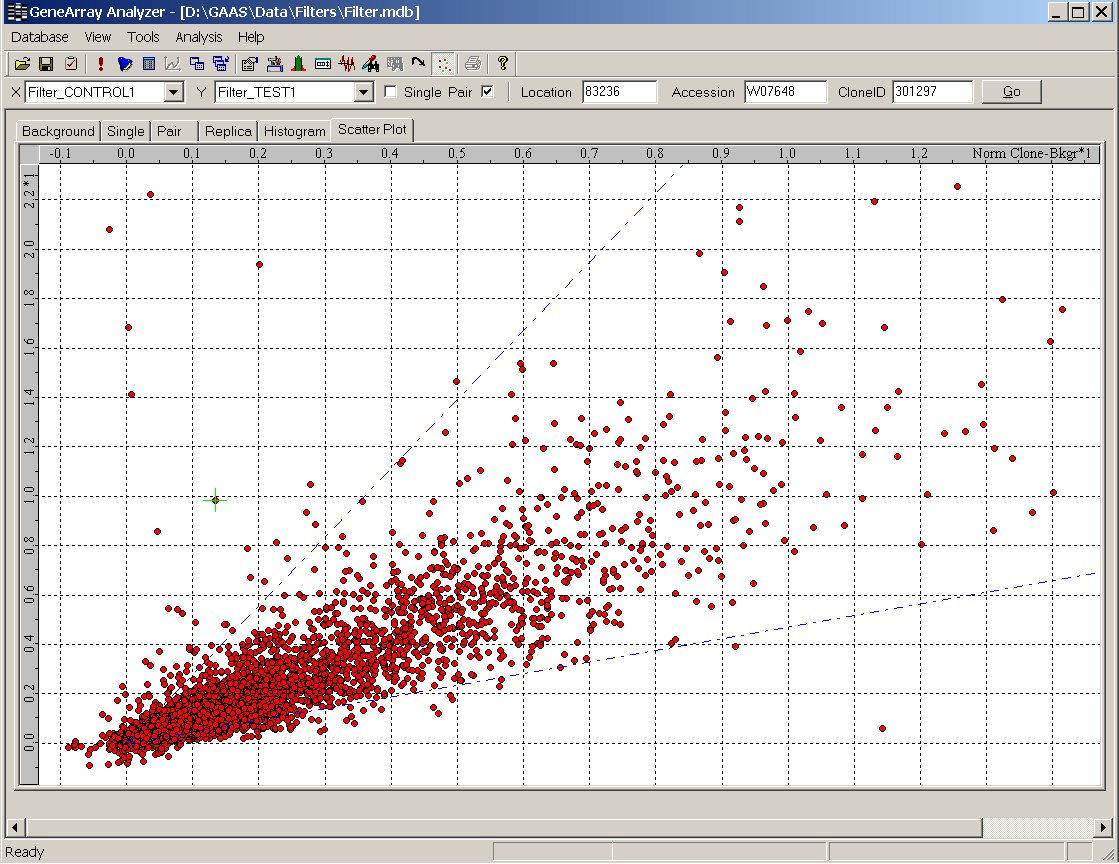
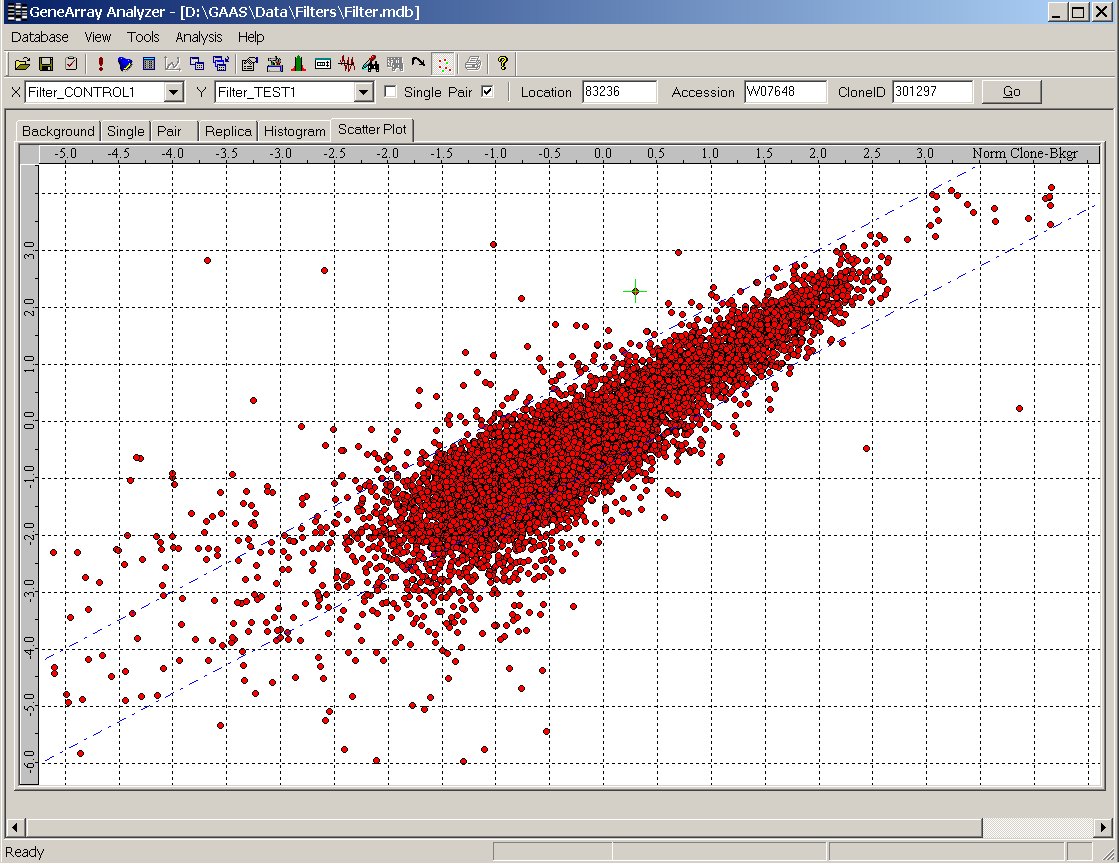
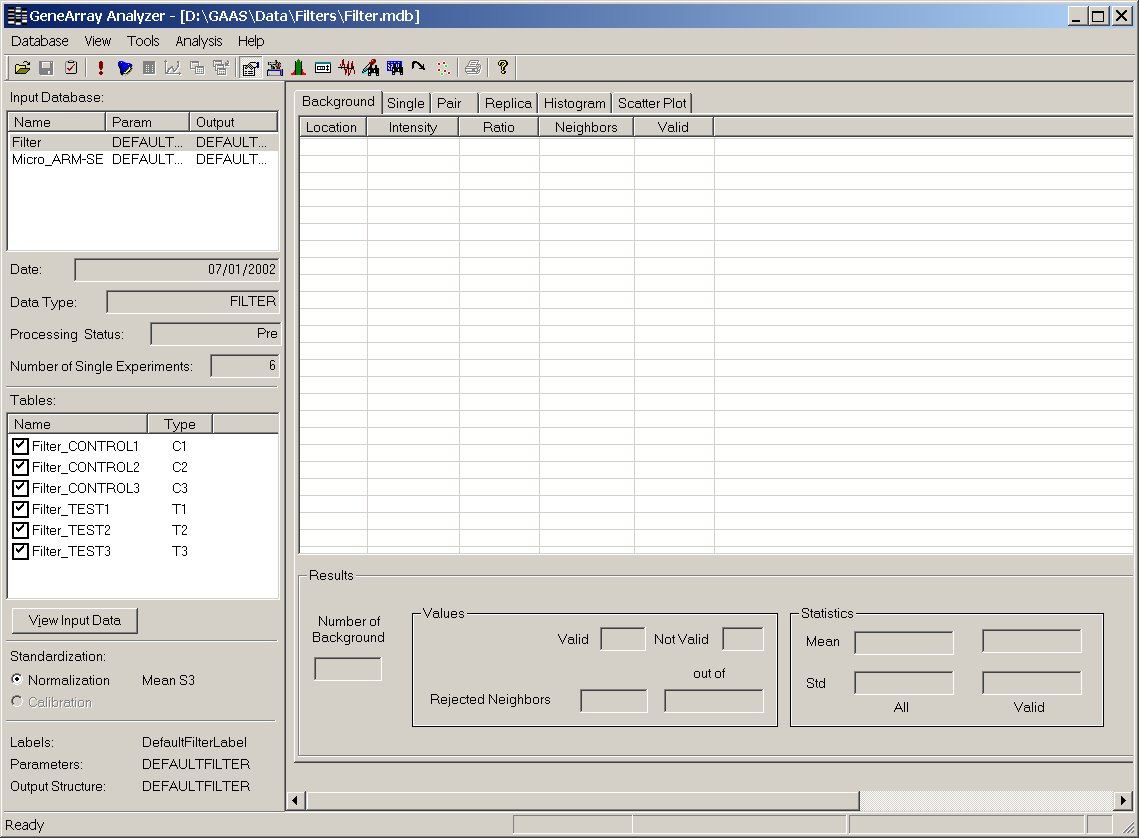
Main Gene Array Assembler Software window

Main Gene Array Analyzer Software window

This window constitutes the user interface for expression data analysis.
MS-Access files containing the standardized input data are loaded together with a correspondent MS-Access database containing array structure labels of the input data. Through this interface the user can define analysis parameters, view analysis results in tabular and graphical form, and define which clone parameter results to store in an output MS-Access data file.

Main Gene Array Analyzer Software window

MasterDB management window

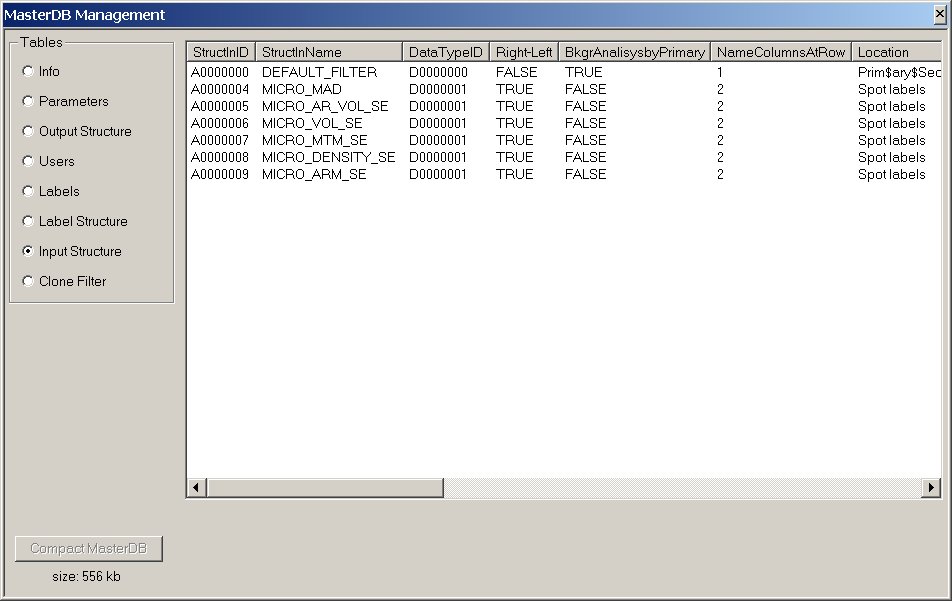
This window enables visualizing and modifying MasterDB table content. Among others, the accessible information concern: general information on analyzed data files; parameter sets used and saved during the analyses; templates of data output structures used to save analysis results; registration data of users granted to use GAAS; general information, structure and content of label files used to identify location and spotted clone for each spot in the array structure; input data structure templates specifying significance and content of any data column of input datasets; SQL queries on spotted clone attributes used to filter a subset of clone values necessary for data normalization or other data processing.
MasterDB management window

Parameter setting window

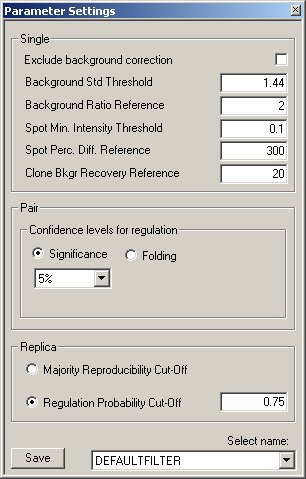
This window allows setting the values of all parameters used for expression analysis. They are grouped for single experimental condition evaluation [Single]; differential gene expression assessment in a single experiment (i.e. test vs. control condition) [Pair]; determination of gene regulation in multiple replica experiments [Replica].

Parameter setting window

Gene expression bound window

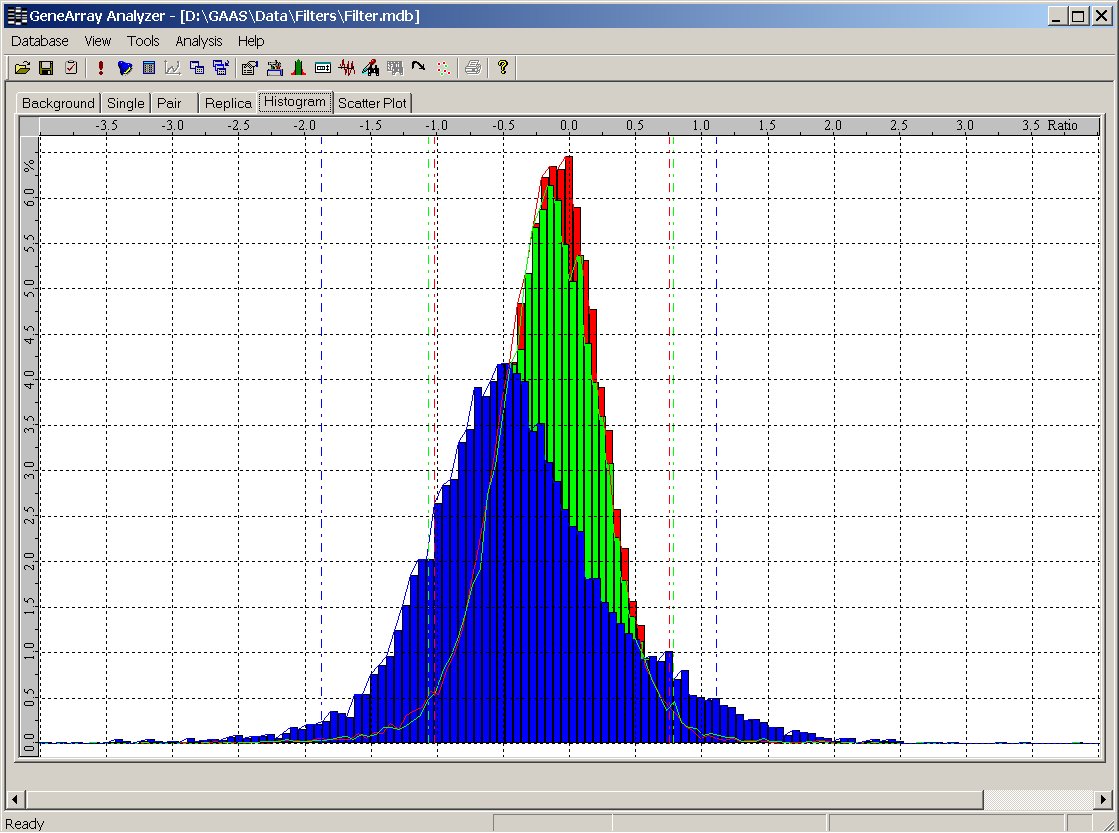
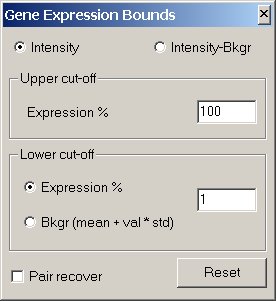
In this window upper and lower thresholds of reliable expression levels can be defined, as a percentage of the distribution of expression intensity values, to exclude low (noise affected) or high (saturated) intensity levels. Moreover, the lower threshold can be computed also as a value proportional to the mean and standard deviation of background intensity level of the array.

Gene expression bound window

Normalization option window

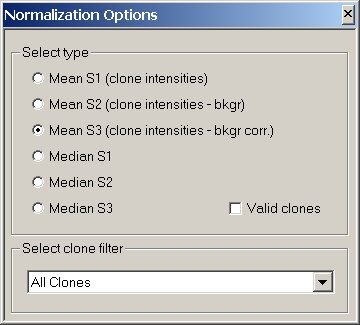
This window enables selecting the procedure to use for normalizing data from different arrays before their comparison. Values from all clones on the array, or only from a selected clone subset, can be used. In both cases low quality clones can be excluded and either mean or median value of clone intensities can be considered as normalization factor.

Normalization option window

Clone search window

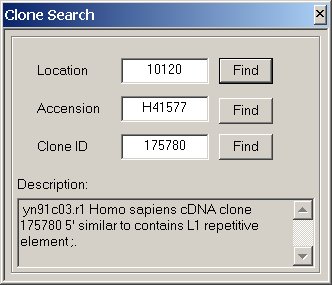
This window enables finding the values quantified during the expression analysis of a clone by means its location on the array, GenBank accession number, or Clone ID.

Clone search window

Show column window

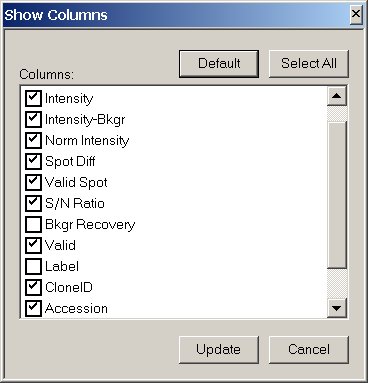
This window allows defining, for each result analysis data panel, which clone values visualize in tabular form in the GAAS visualization framework. Here the selectable values concerning the analysis of a single experimental condition are showed.

Show column window

About Gene Array Analyzer Software window

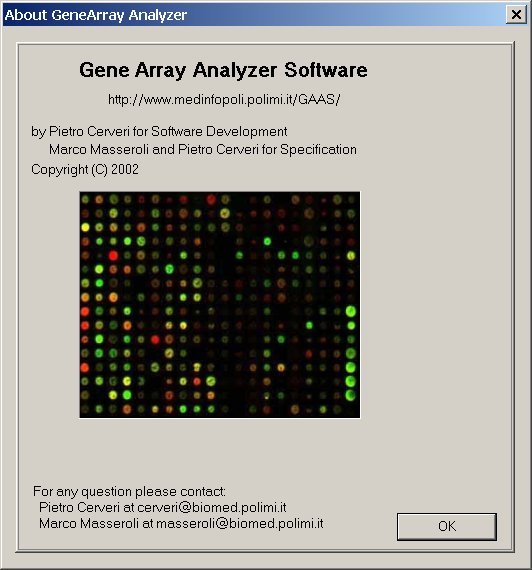
In about Gene Array Analyzer Software window current version, acknowledgments, and copyright of GAAS are specified.

About Gene Array Analyzer Software window

Saving option window

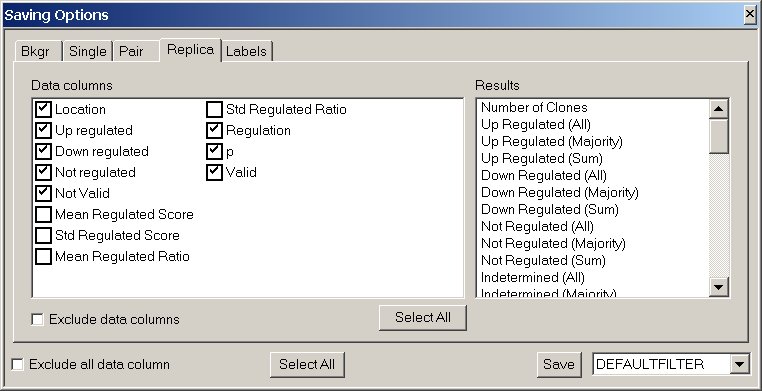
In the panels of this window it is possible to select which clone parameter values, calculated during the analysis, are to be saved in the output database.

Saving option window

Input array data type assignment window

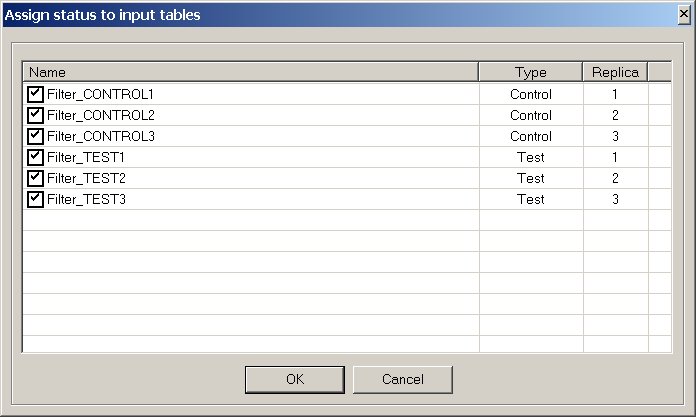
This window allows the identification of each input dataset as a control or test experimental condition, and assigns a progressive number to replicated experiments.

Input array data type assignment window

Input data window

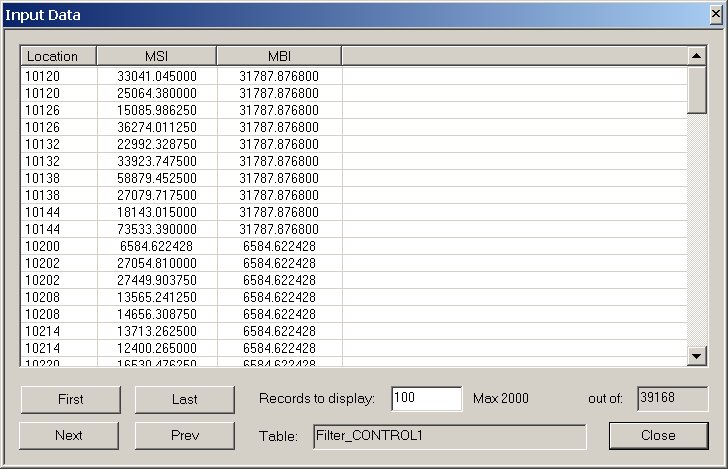
This window enables the visualization of input values of array spot parameters (e.g. Location: spot location on the array; MSI: mean spot intensity; MBI: mean spot background intensity).

Input data window
Result interface: Background panel

This panel shows values of the background analysis for a single array and the summary background analysis results for the whole array.
Ratio: ratio of a background intensity value with the mean intensity value of its acceptable background neighbors; Neighbors: number of good quality background neighbors; Valid: the quality label automatically assigned to each background value according to its significant statistical difference from background neighbors.

Result interface: Background panel
Result interface: Single panel

This panel shows clone values generated during the analysis of a single array experimental condition and the summary analysis results for the whole array.
Valid spot: spot quality label automatically evaluated on the basis of percentage difference (Spot Diff) among the intensity values of each clone spot in the array; Valid: clone quality label automatically computed as matching of background and spot quality labels.

Result interface: Single panel
Result interface: Pair panel

This panel shows clone values generated during the analysis of a single comparative experiment
(test vs. control condition) and the summary analysis results for the whole experiment.
Ratio: test/control clone intensity ratio; p: statistical significance of determined clone regulation (Regulation) in the analyzed single experiment; Valid: clone quality label in the analyzed single experiment, in case of low quality its source (background or spot of test or control condition) is specified.

Result interface: Pair panel
Result interface: Replica panel

This panel shows clone values generated during the analysis of a multiple replica experiment and summary analysis results for the whole replicated experiment.
Up regulated, Down regulated, Not regulated, Not valid: number of single replica experiments in which a clone expression is up, down, or not regulated, or of low quality, in the test vs. the control condition;
p: statistical significance of determined clone regulation (Regulation) in the analyzed replicated experiment; Valid: clone quality label in the analyzed replicated experiment.

Result interface: Replica panel
Result interface: Histogram panel

This graphic panel enables comparing intensity distributions of gene expression levels in multiple experiments.
Ratios of normalized clone expression intensities of test vs. control condition in three replicates are shown in logarithmic scale.

Result interface: Histogram panel
Result interface: Scatter Plot panel

This graphic panel allows visual identification of regulated genes.
Dashed lines represent upper and lower bounds of two and three fold regulation.
Clone expression intensities in a test vs. control condition are shown.

Result interface: Scatter Plot panel (linear scale)
Linear scale.

Result interface: Scatter Plot panel (logarithmic scale)
Logarithmic scale.


© Marco Masseroli, PhD E-mail masseroli@biomed.polimi.it - Last update on .