MuSERA: Multiple Sample
Enriched Region Assessment
Enriched Region Assessment
Documentation
- A complete MuSERA tutorial is available at this link
Screen shots
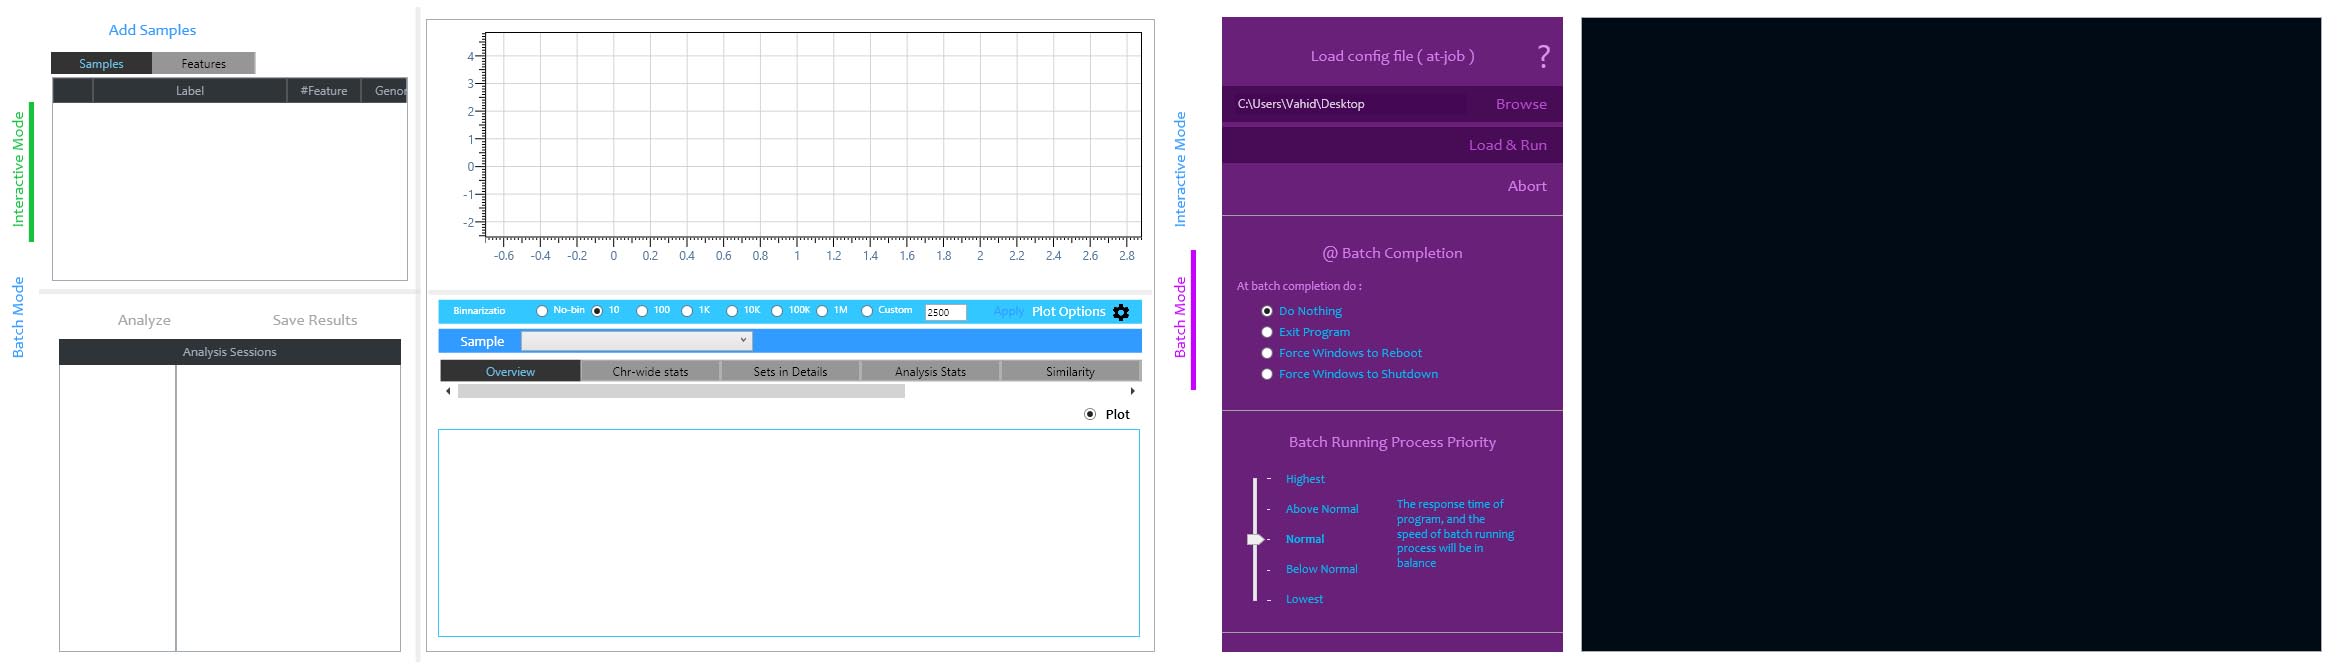
Interactive (left) and Batch (right) running modes of MuSERA
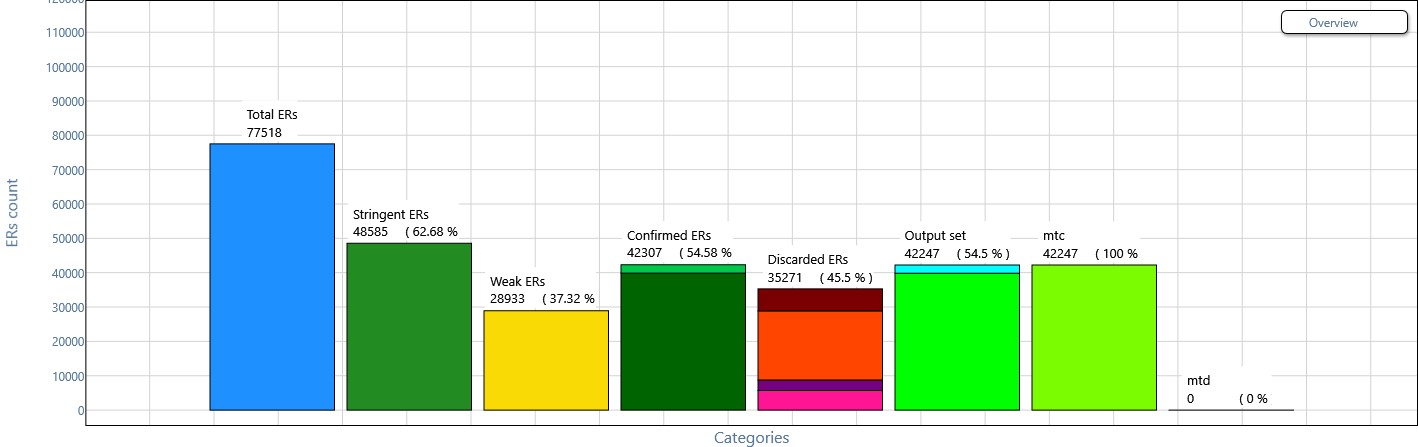
Overview plot of combining evidence in multiple replicates
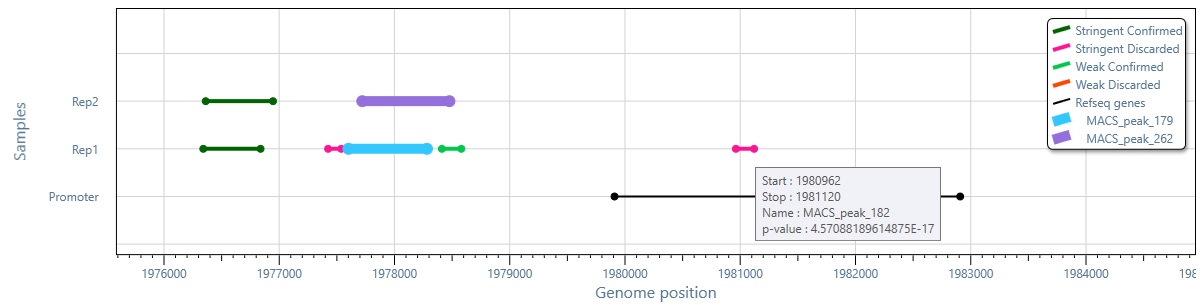
Interactive genome browser integrated in MuSERA with zoom-in, zoom-out and pan functionalities to see how enriched regions on replicates are evaluated, and how they co-localize with known genomic features such as promoter regions.
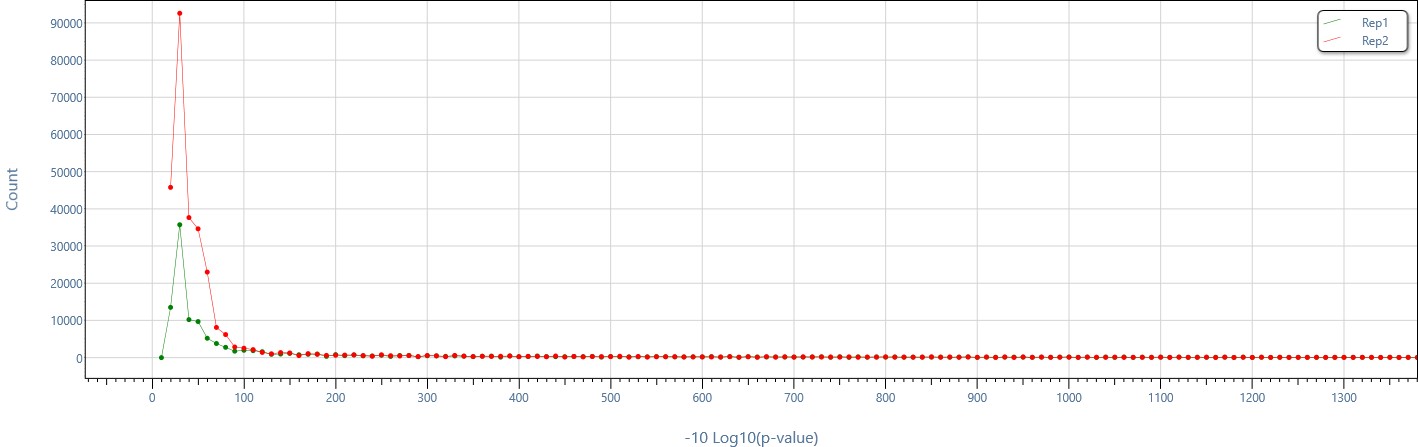
Single-click p-value distribution plot to easily compare the distribution of enriched region p-values across replicates.
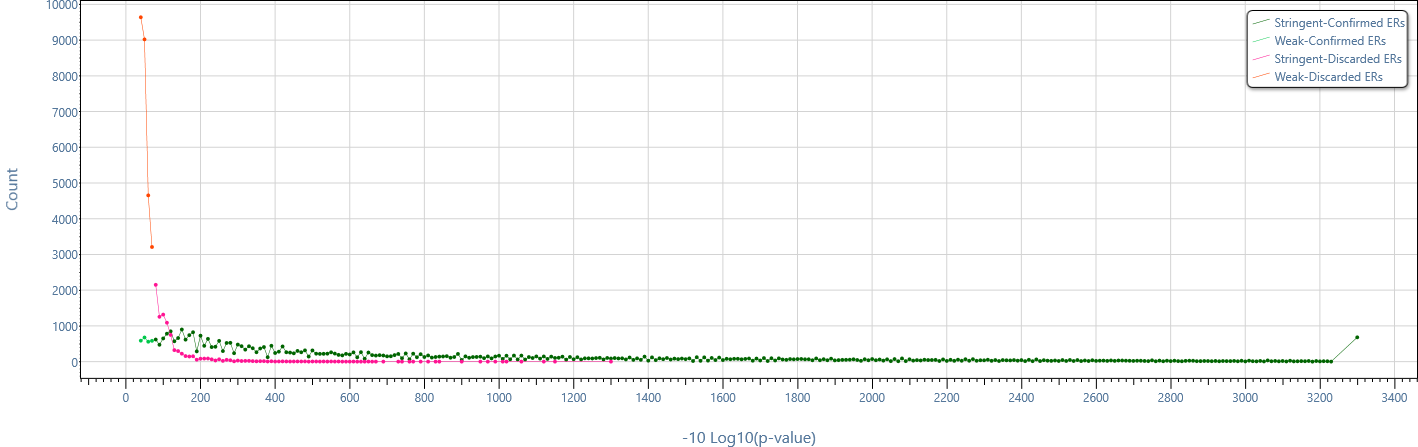
Distribution of enriched region p-values in different computed enriched region sets
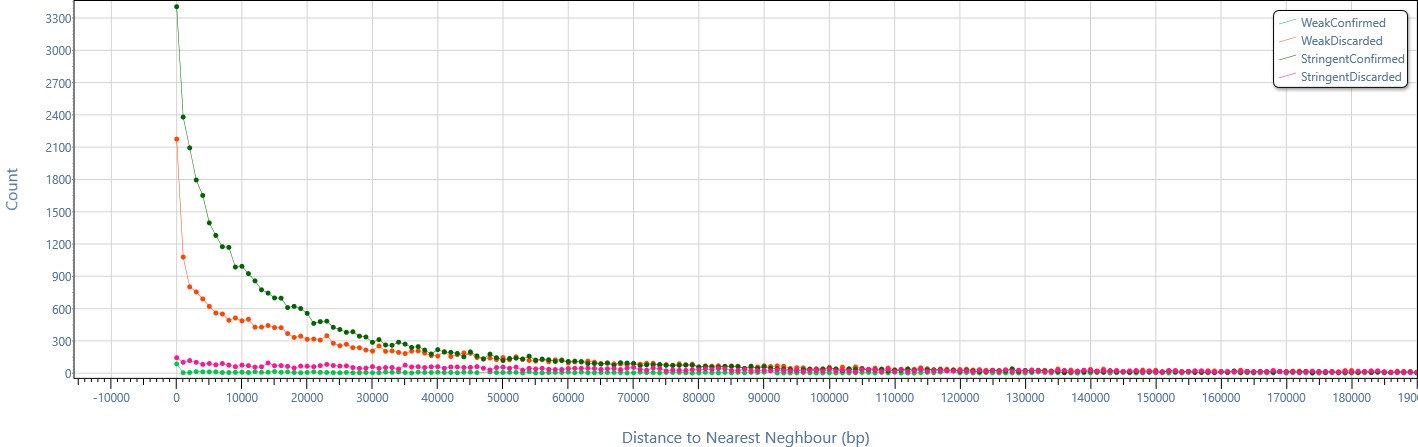
Nearest neighbor analysis allows checking how close the enriched regions of different computed sets are, e.g., in this example, stringent-confirmed enriched regions are mainly very close to each other.
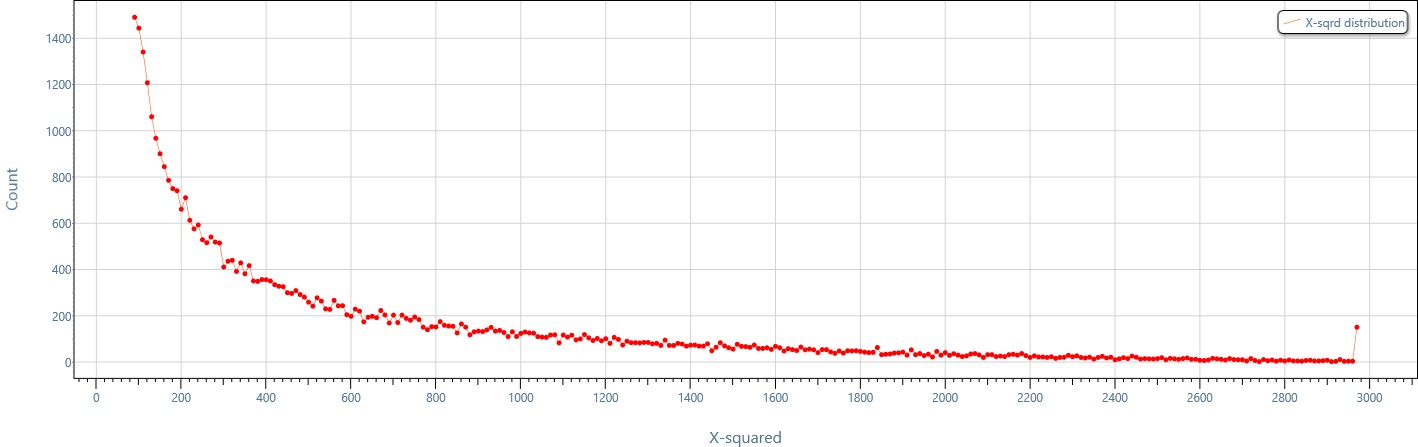
Distribution of combined evidence in a single-click!
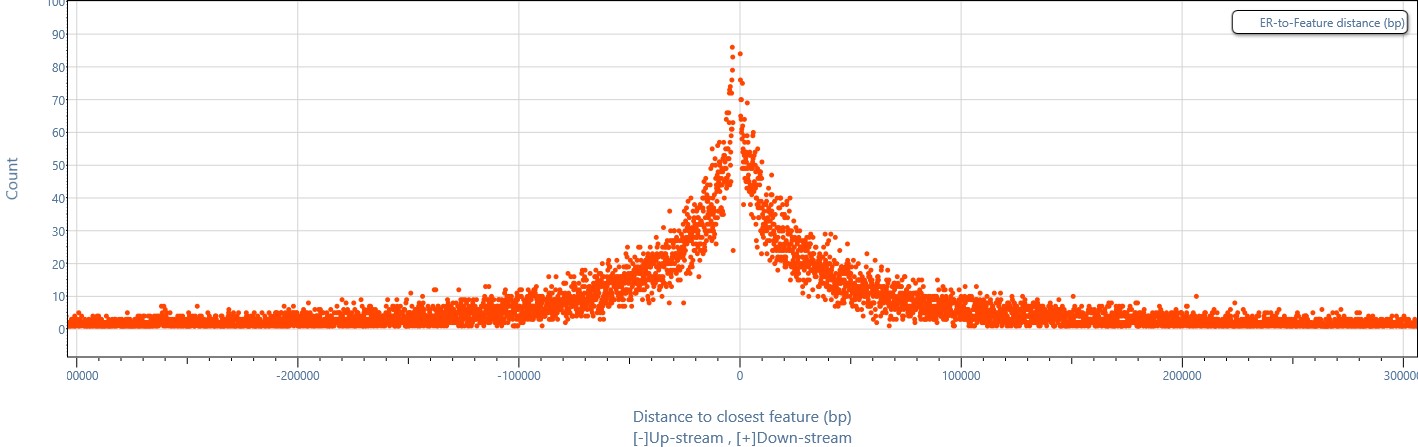
Fast and easily customizable functional analysis integrated in MuSERA: allows plotting the distances between enriched regions from different sets and known genomic features.
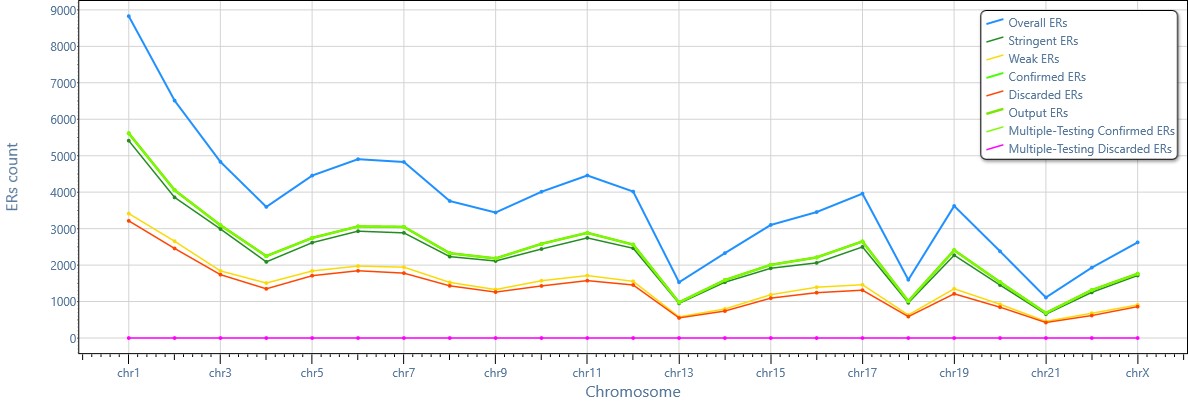
MuSERA provides all the information chromosome-wide: e.g., an overview of the results of the analysis of different sets of enriched regions stratified by chromosome.