Help
This page helps you in better understanding how to use the user interface of GPKB. This page is divided into two sections: Easy search, regarding the web interface to easily search and extract data in the GPKB, and Metadata, related to the exploration of the Metadata part of GPKB.
Help about how to properly use the Basic search section the GPKB is available at Basic search - help page.
Web services for the GPKB are also available at GPKB RESTful Web API.
Video demonstration (top)
This video tutorial shows how to use the Easy search interface, starting from how to visually compose a query on the GPKB by selecting the features of interest to be searched (e.g. gene, protein, pathway, genetic disorder, ...); then, it shows other aspects of the GPKB Easy search interface, such as how to specify the required data attributes or how to filter the retrieved results based on some values of some data attributes. As an example scenario, the search for genes involved in both the "Breast cancer" and "Prostate cancer" is shown. After visually composing the related query on the GPKB and retrieving the corresponding results, the initial query is expanded to retrieve also the pathway associated with some, user selected, of the retrieved genes and to show the results ordered by pathway names.
Easy search video
Easy search (top)
From any GPKB web page, the user can start the Easy search by clicking the Easy search link at the top of the page.
Select features (top)
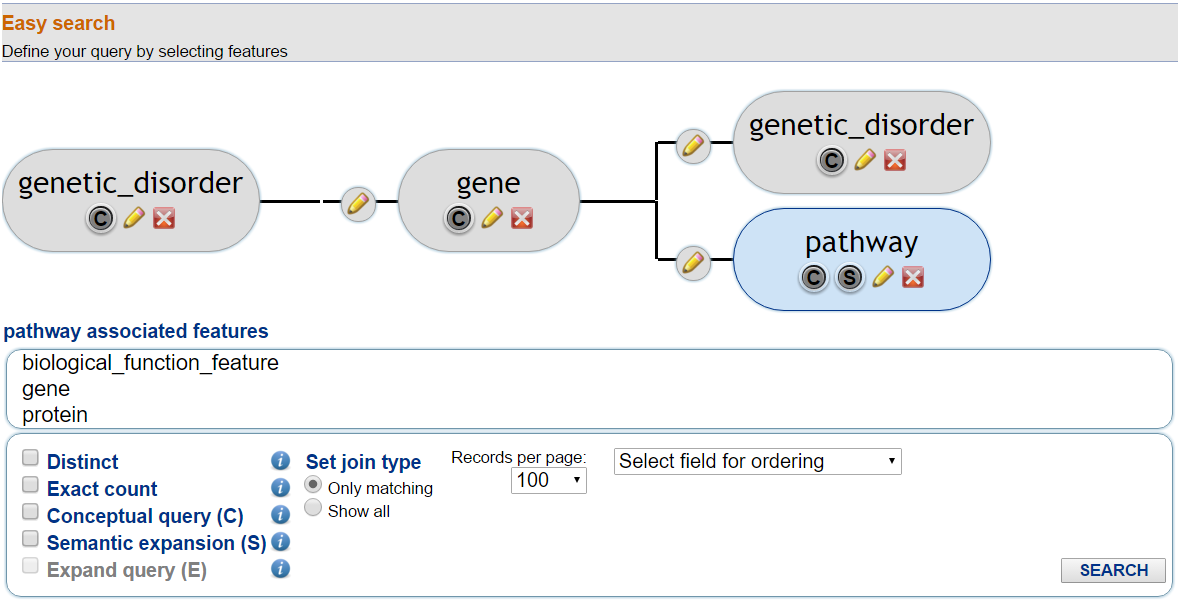
From the query graph builder at the top of the Easy search page, the user can select the features and their associated features to search.
In this way the user can build the query as a tree structure of the associated features to search.
In Fig. 1, an example tree structure is shown.
In this example, a query to search for genetic disorders and the associated genes that are associated with a genetic disorder and with a pathway is shown.
In the result table, the extracted results will regard every gene in the GPKB associated with one or more genetic disorders and a pathway.
Fig. 1 - Select feature
Filter options (top)
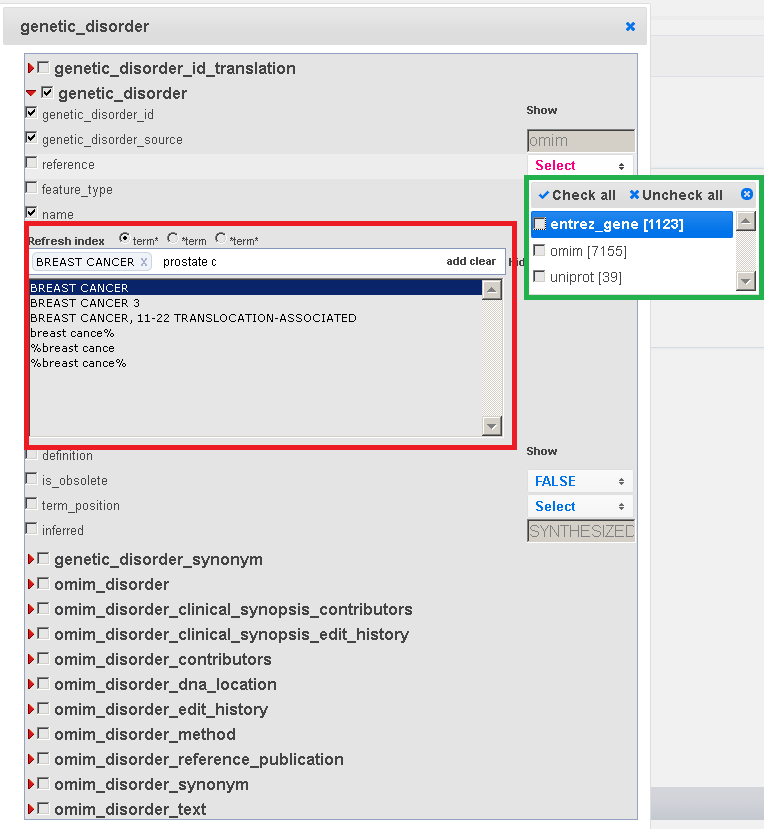
By clicking the edit button (  - Fig. 1) on a feature element in the query graph builder, the user can open the Feature window of that feature, where the query display and filtering constrains can be defined for any attribute of the feature, as shown in the Fig. 2 for the genetic disorder feature.
In the Feature window, more attributes of the feature can be added to the result; to do so the user has to select the checkbox of the desired attribute.
- Fig. 1) on a feature element in the query graph builder, the user can open the Feature window of that feature, where the query display and filtering constrains can be defined for any attribute of the feature, as shown in the Fig. 2 for the genetic disorder feature.
In the Feature window, more attributes of the feature can be added to the result; to do so the user has to select the checkbox of the desired attribute.
In the Feature window the user can also specify query filtering options; for example, in Fig. 2 the user selected "Breast Cancer" as the only required genetic disorder.
Multiple ways to specify filtering options are available;
The first one is the autocomplete menu, which is available for the GPKB attributes with many values, mainly for textual value attributes (see in Fig. 2 the name field).
Autocomplete menu
Clicking on the "Show" label on the right hand side of some attributes, the autocomplete menu appears, which helps the user in searching for the values of that attribute that can be used for filtering the query results.
In Fig. 2, this menu is shown within the red box.
After typing some characters and selecting the "Show list" label, the autocomplete list of such characters is shown in this menu, with the values of that attribute in the GPKB which contain the typed characters.
The user can then select a single or multiple values from such autocomplete list as filtering constrain values for that attribute.
The user can then start another search for other filtering values for that attribute, after typing new text and pressing the "Refresh index" label.
The user can do this search using three different methods, available on top of the menu:
- "text*": search for the attribute values starting with the typed text
- "*text": search for the attribute values ending with the typed text
- "*text*": search for the attribute values containing the typed text
This autocomplete menu can be hidden by clicking on the "Hide list" label and all the selection menus can be hidden by clicking on the "Hide" label.
Another way to specify query filtering options is through the Multiple select menu
In Fig. 2, in the green box a multiple select menu is shown. This menu is available for the attributes of the GPKB which have controlled values and less than 15 different values.
Clicking on the checkbox near each value it is possible to select the values of interest for the attribute, to be used for filtering the query results.
Fig. 2 - Edit menu
Query general options (top)
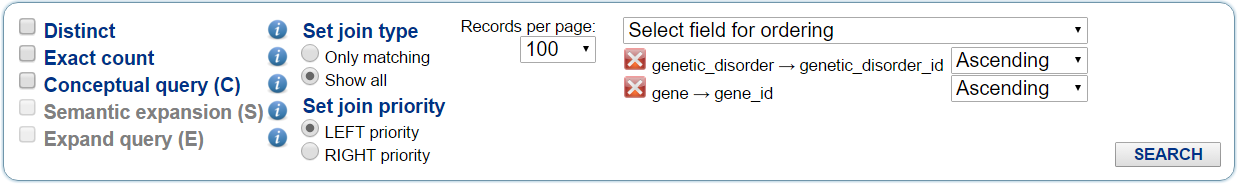
The user can select the general options for the query from the menu below the query graph builder, as shown in Fig. 3. The following options are available.
- Distinct: If selected, it retrieves only distinct results.
- Exact count: If selected, it runs exact count of the query results, otherwise it estimates the result count.
- Conceptual Query: The data integrated in the GPKB contains similarity data and
history data provided by sources. The similarity data are the ID references between the different
sources or within the same source, and the history data contain the formerly active IDs that are merged
with another one or become obsolete. These ID entities are defined as conceptually equivalent entities in
the GPKB. When a query is executed with the conceptual query option selected for a feature then the result contains not
only the items that satisfy the query but also the conceptually equivalent items integrated in the
database.
Conceptual query expansion is available for a single feature by using the check box with letter C on the feature module ( - Fig. 1).
- Semantic expansion:
When a query is executed with semantic expansion for a feature
then the result contains not only the items that satisfy the query
but also semantically related more general items based on the feature ontologies integrated in the GPKB.
In other words, they are composed of the direct annotations, as well as, all the
indirect annotations to the ancestor terms defined by the ontology; usually, all these indirect
annotations are not provided by the original databases integrated in the GPKB.
Semantic query expansion is available for a single feature by using the check box with letter S on the feature module ( - Fig. 1).
- Expand query: After obtaining results for an initial query, to expand the query
only for the user selected rows of the previous query result; the expansion is done on the
feature(s) selected in the query graph.
Expand query for selected features is available for a single feature by using the check box with letter E on the feature module ( - Fig. 1).
Records per page: number of results shown in each result page.
Select field for ordering: from this menu the user can select the attributes to be considered to order the query results according to such attribute values; then, the user can change the order of these selected ordering attributes by dragging them with the mouse, and can select the ordering of each attribute values as ascending or descending.
Fig. 3 - Query general options
Results (top)
After clicking the search button, the query results are loaded into the result table on the bottom of the page.
The user can see as a message above and below the result table if the counted number of query result entries is exact or approximated.
From the result table, by selecting the checkbox in the table first column of each row, the user can select the rows for the query expansion.
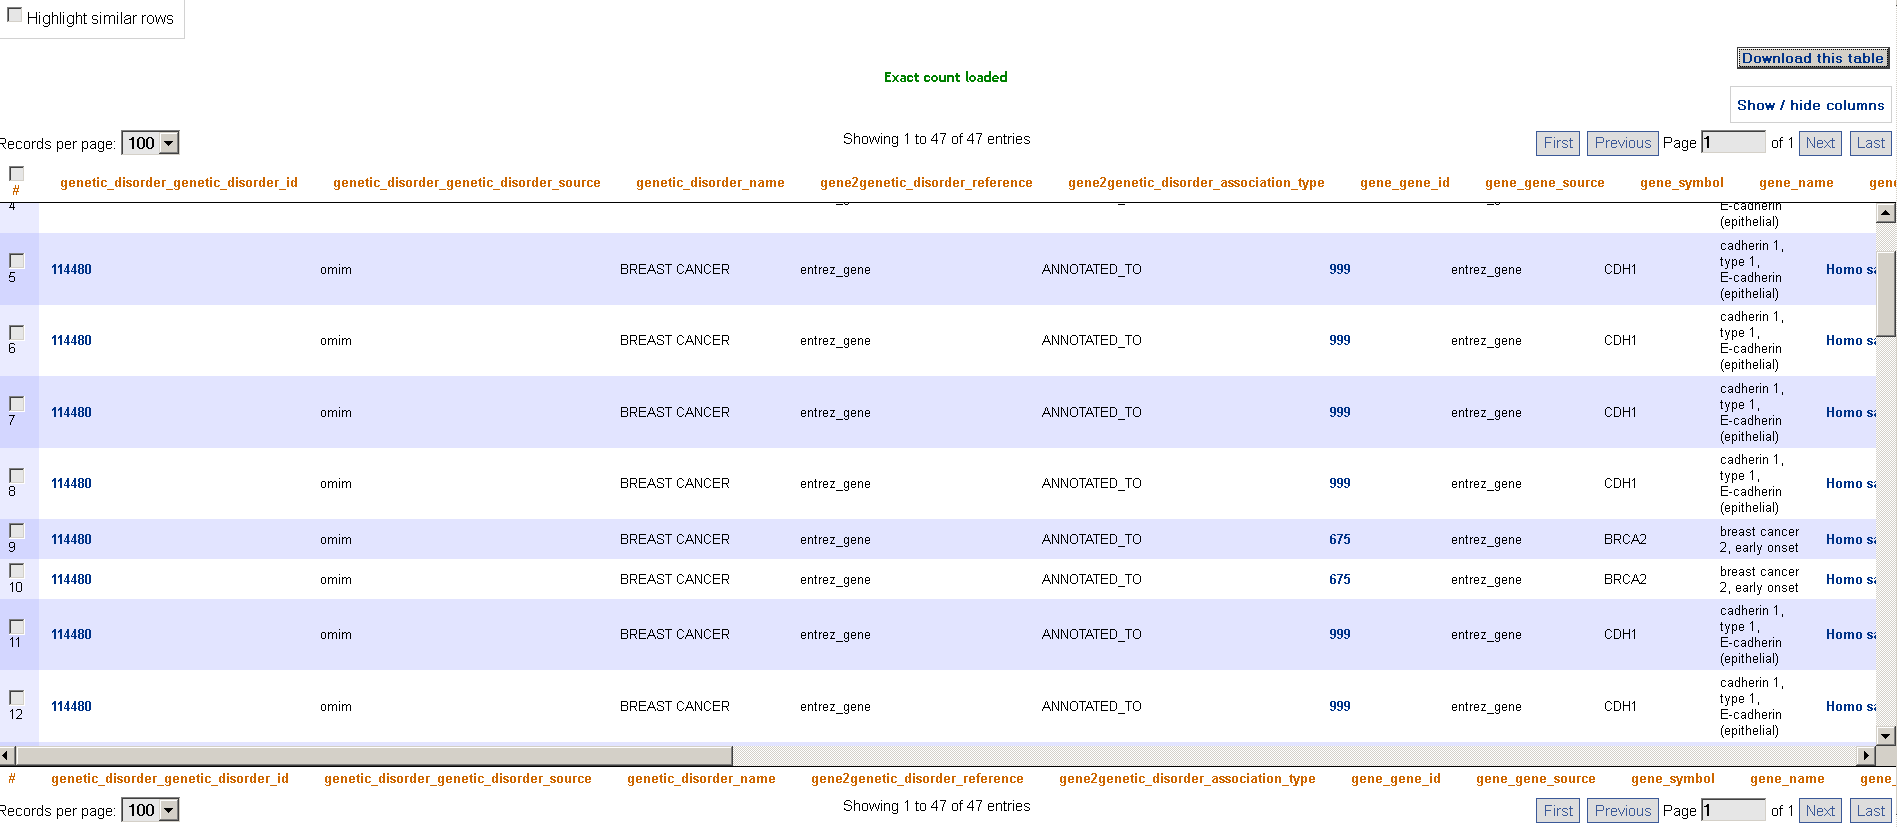
By selecting the checkbox Highlight similar rows, the user can highlight all the rows which have the same value for the attribute in the result table which is under the mouse cursor: this allows better understanding of the obtained results.
Fig. 4 - Result
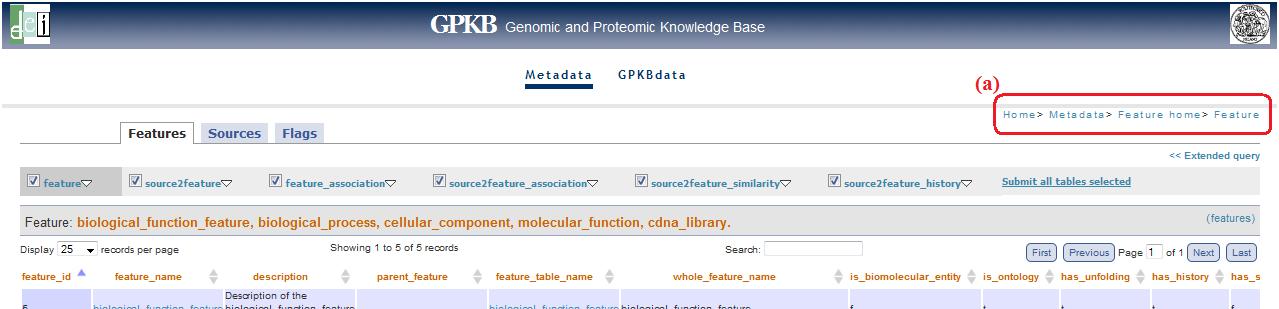
Metadata (top)
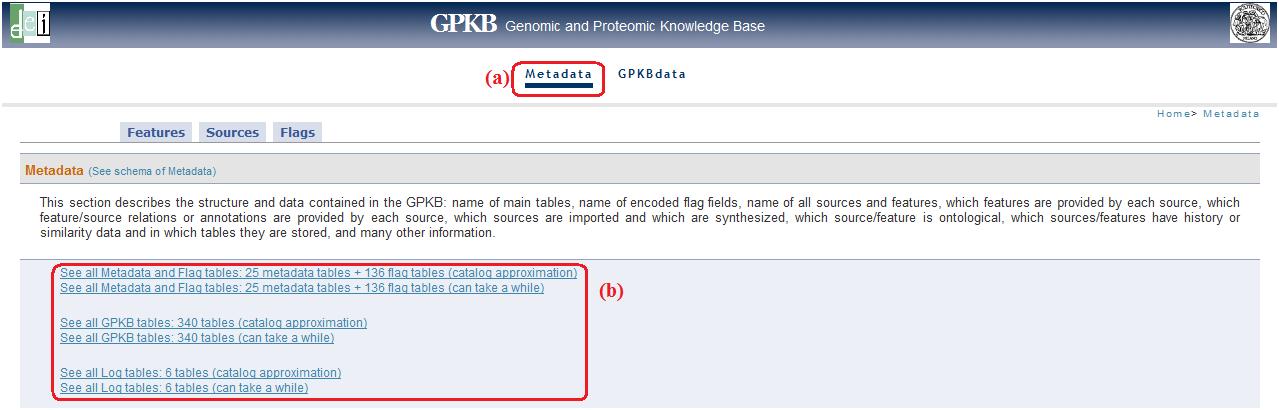
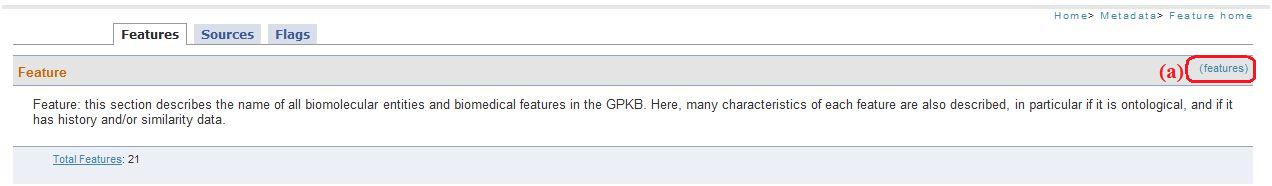
This link (fig. 1a) allows accessing a metadata description page. Below the descriptions there are links (fig. 1b) to visualize pages with all tables name and their respective record number .
For each scheme (Metadata, Public, Log) there are two links: the first (catalog approximation) allows only to estimate the real records number, the second one, instead, allows to get a real time record count.
Fig. 1
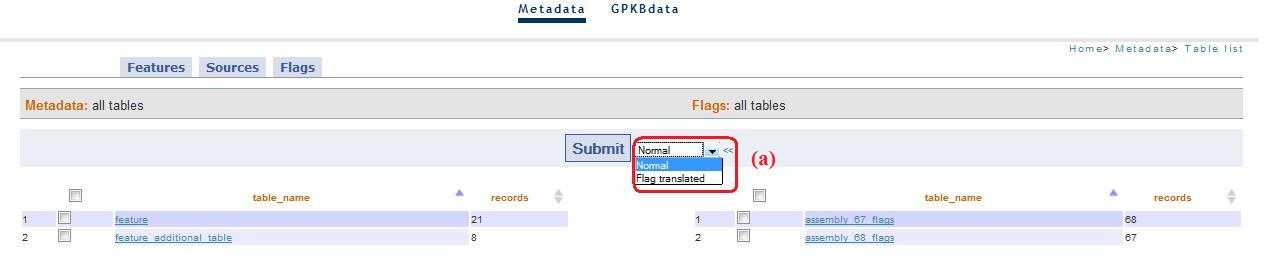
In these pages you can select some tables to visualize the content and you can choose the modality "flag translate" (simplify visualization, fig. 2a).
Fig. 2
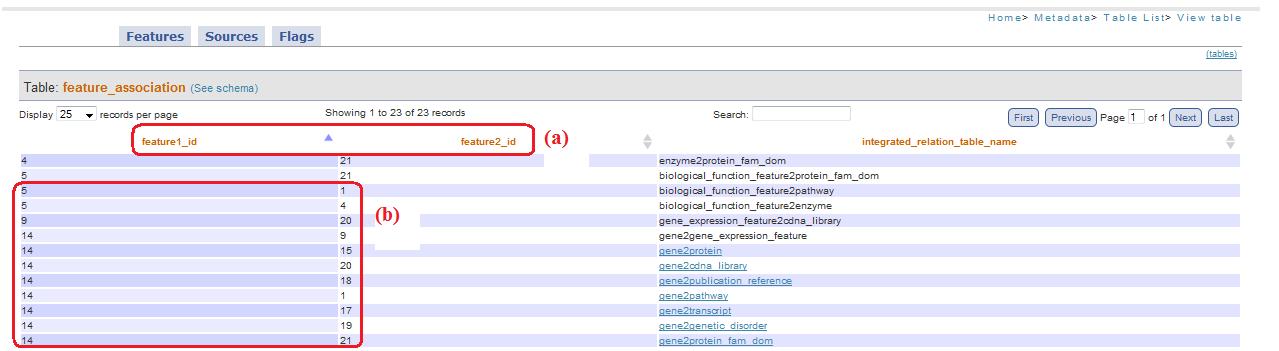
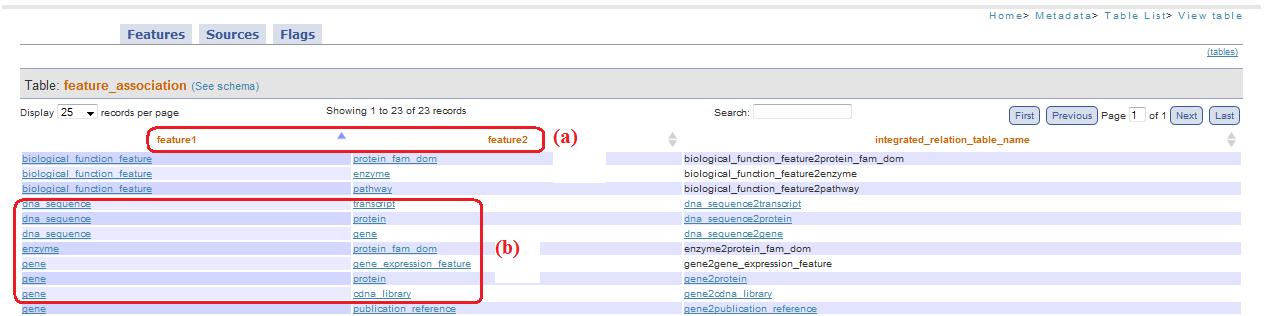
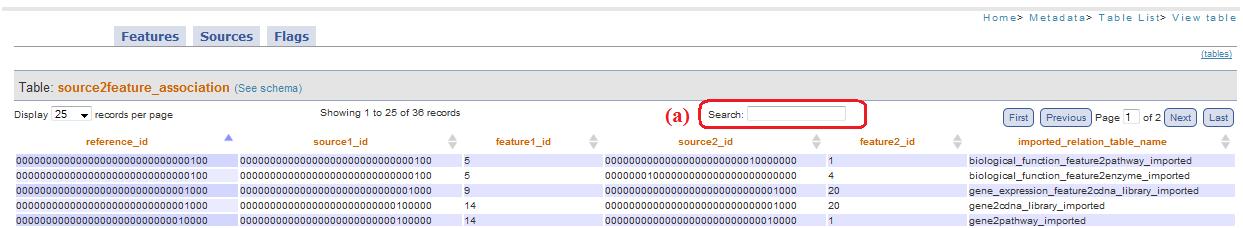
Selecting “normal” (that is the default option) the table will be visualized as it is. For example, in figure 3, the table selected is feature_association and, as you can see, there are shown feature1_id and feature2_id (fig. 3a) with their numerical values (fig. 3b).
Fig. 3
If you chosen, instead, “flag translated” in the combobox, feature1_id and feature2_id become feature1 and feature2 (fig. 4a), allow to simply recognize at which feature they are related, transforming the id in its corresponding textual name (fig. 4b).
Fig. 4
In these pages (date_table.php, gpkb_data_table.php, all_tables.php) the link at the top right (“tables”, fig. 5a) allow to shift quickly through the visualized table, keeping the option chosen (normal or flag translated).
Fig. 5
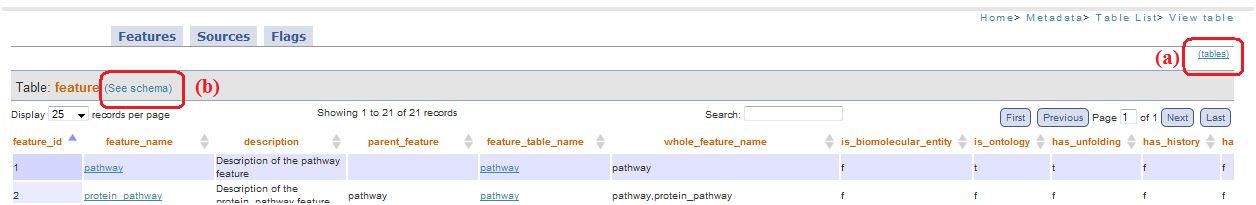
Clicking on“see schema”(fig. 5b) is possible to visualize the scheme: this allow to get informations about table structure (derived from db catalog).
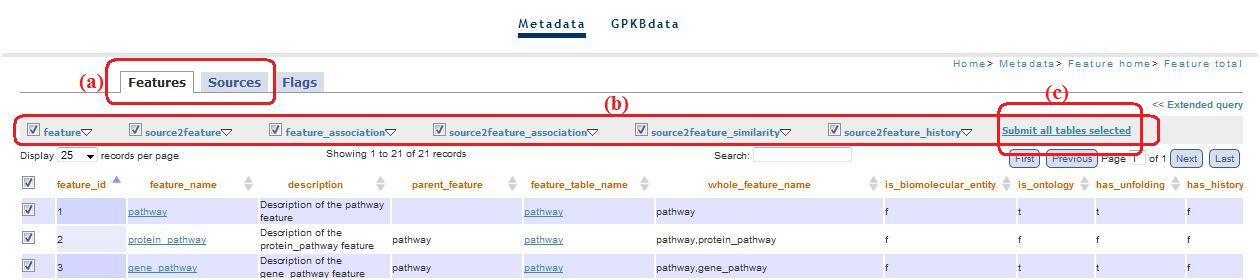
Tabs Features and Sources (fig. 6a) (top)
You can navigate through these tabs using a menu (fig.6b) that allow the dynamic query construction, thus the construction of tables that visualize data.
Fig. 6
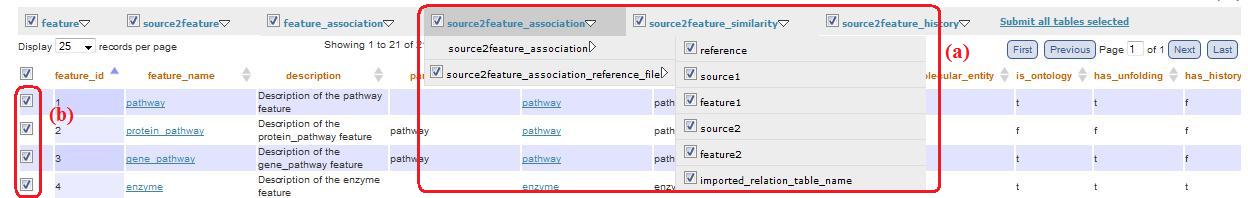
This menu allow a simplify navigation of the main metadata tables. In the first menu level there are the main tables names. Submenus consist of tables linked to the main ones. Through checkboxes you can visualize which tables and which columns you want (fig. 7a).
Fig. 7
When you have selected tables and columns, clicking on the main table (i.e. feature, source2feature, feature_association, etc) you are redirected to a visualization of a table with all data of the tables selected. The visualised table is filtered on the basis of all features/sources selected through the checkboxes (fig. 7b) in “feature_total.php/source_total.php” or through the “combobox” that appear clicking on the top right link, at the title level (fig. 8a).
Fig. 8
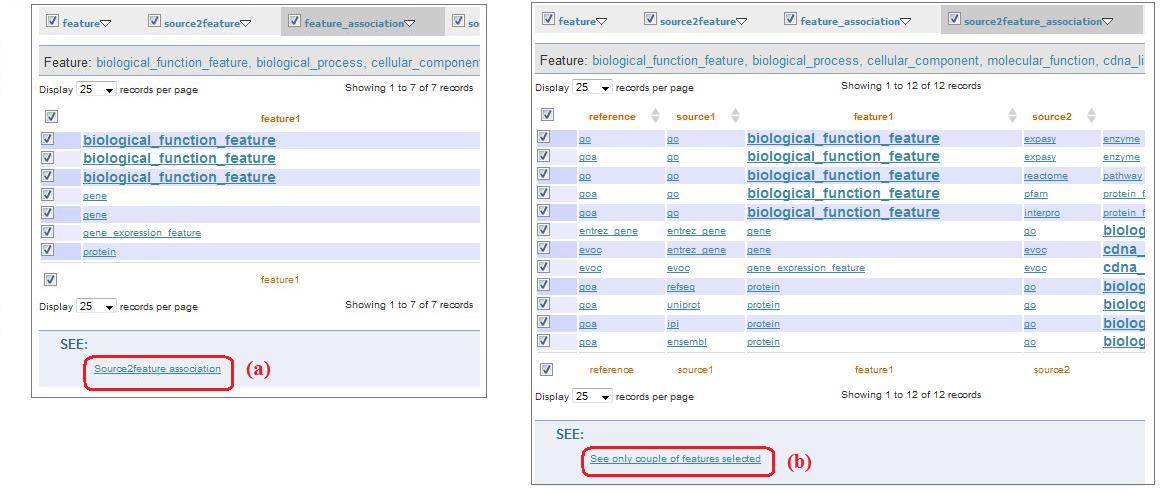
Clicking on “Submit all tables selected” (fig. 6c) you can see a page visualizing all the tables selected. The first level menu checkboxes allow to exclude the tables you don't want to visualize in this page (“feature_results/source_resulted.php”). The pages reachable clicking on “feature_association” and “source2feature association” contain checkboxes: through these checkboxes, clicking on links below the table(“Source2feature association” and “See only couple of features selected”, fig.9a and fig. 9b, respectively), you are redirected to a page that visualize the relationship between selected features (i.e. feature1 and feature2).
Fig. 9
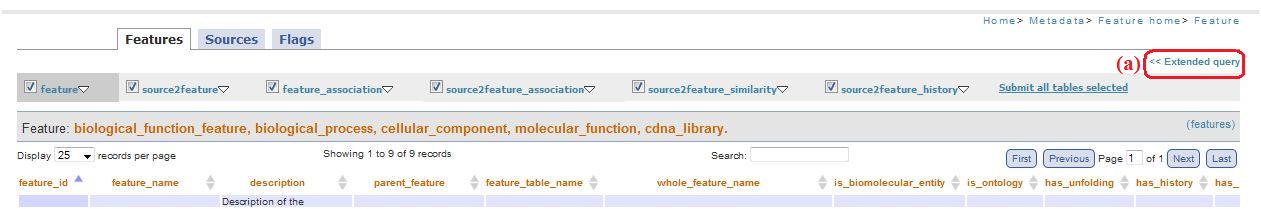
Extended query (top)
In all the pages where there is the menu for the simplify navigation (see above, fig. 6), you can find also the link “Extended query” (fig. 10a).
Fig. 10
Clicking on this link, you'll see an interface through you can create your own query for the data visualization, choosing tables, columns and type of join between the tables, eventually filtering these tables in basis of selected feature/source. If you choose one or more tables that can't be joined with the others, an error message will be visualized, with the indication of this or these tables. To avoid this error you can use the informations getted by the metadata image, reachable from metadata home ("statistical_metadata.php").
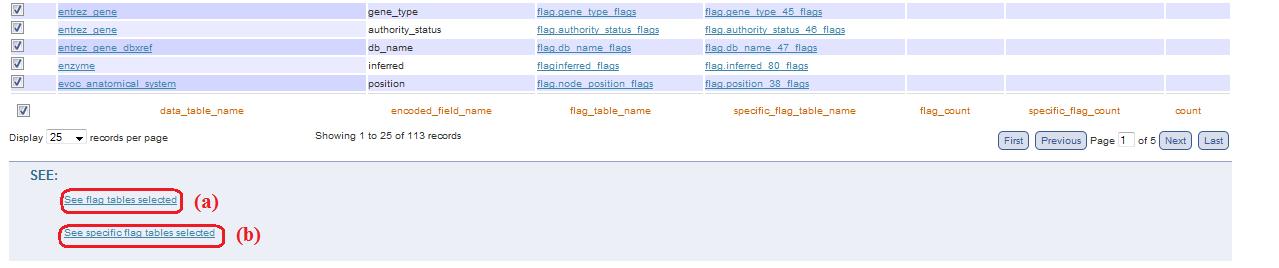
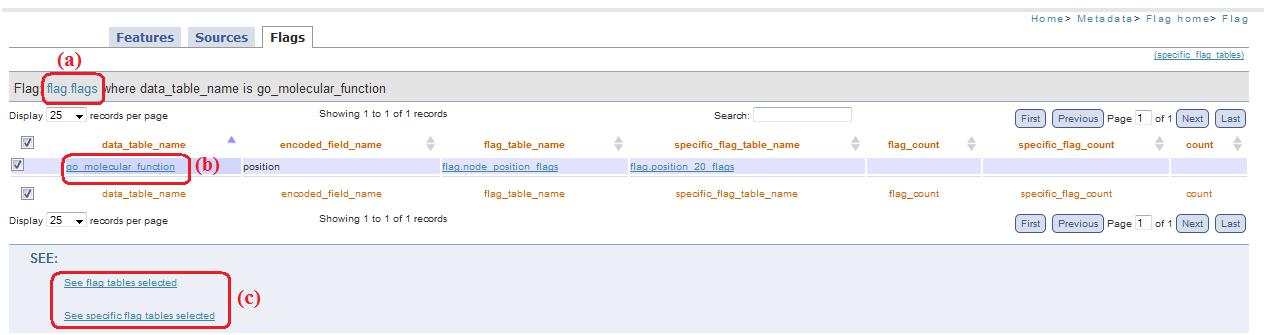
Tab Flags (top)
Navigation into tab Flag is possible through checkboxes of the tables of interest: according to what do you want to see (specific_flag table or flag_table) you can click on the corresponding link, below the table (fig. 11a and fig. 11b).
Fig. 11
Change column order (top)
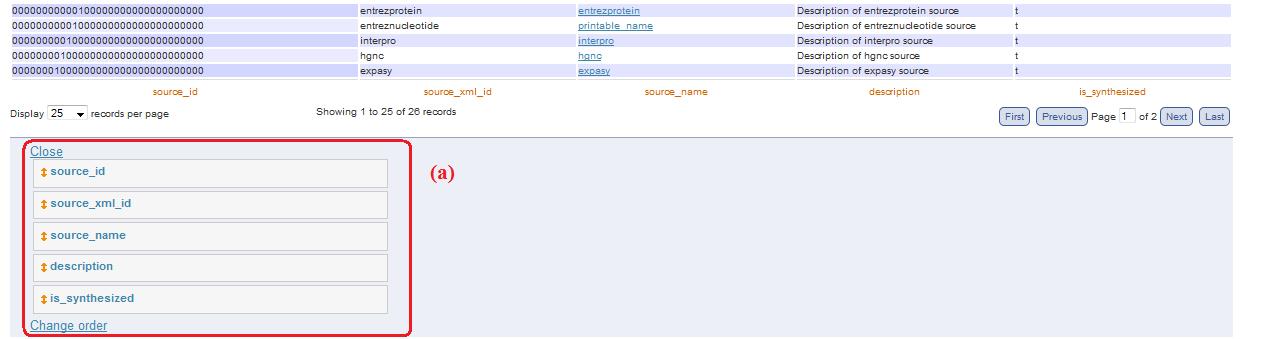
Below each table, you can find this link useful to open a panel that allow to change column order (fig. 12a). To change column order, you have to drag the column name in the new position. One you have ordered the columns in the desired position, you have to click on “change order”.
Fig. 12
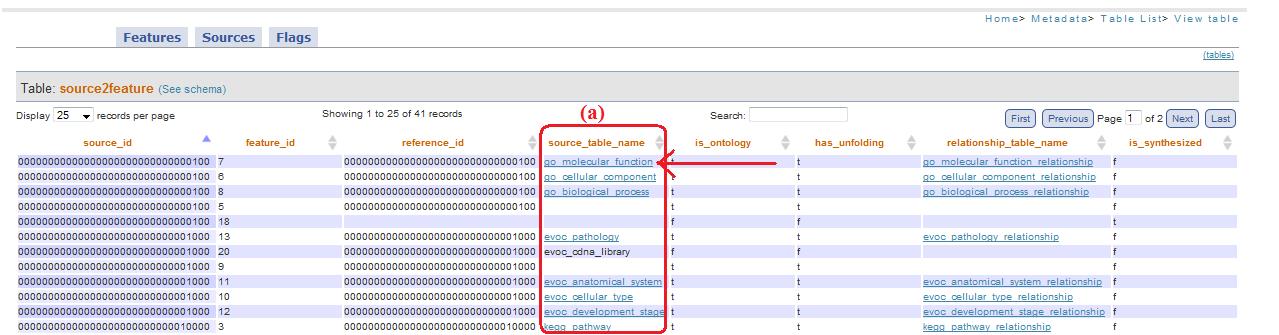
Column *_table_name (top)
If the column is type *_table_name is possible to have some records with links (fig. 13a).
Fig. 13
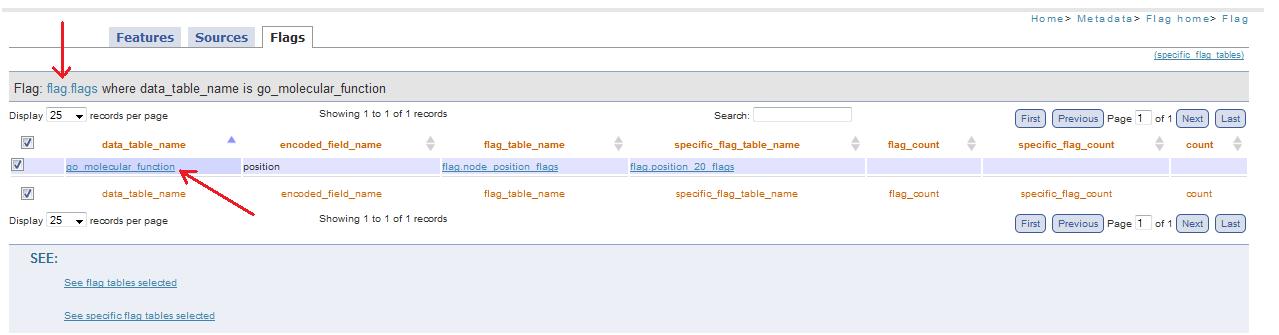
When this link is present, it mean that this field (that represent a table of the public scheme) corresponds to an encoded value present in Flags table (fig. 14a). So clicking on this link you are redirected to flag.php page, that allow to visualize which are flag_table and specific_flag_tabel (fig. 14c) of the table selected (fig. 14b).
Fig. 14
Tables with checkbox (top)
Tables with checkboxes in Features, Sources and Flags tabs present some links below the table. In these links is specified which kind of filter is apply to the table. You can find an example in the pages reachable clicking on source2feature_association or feature_association in the tab Feature menu (see above, fig. 9).
Box Search (top)
On the top of each table you can find this box: it allows you to search between all table records, in all pages. (fig. 15a)
Fig. 15
Link on page title (top)
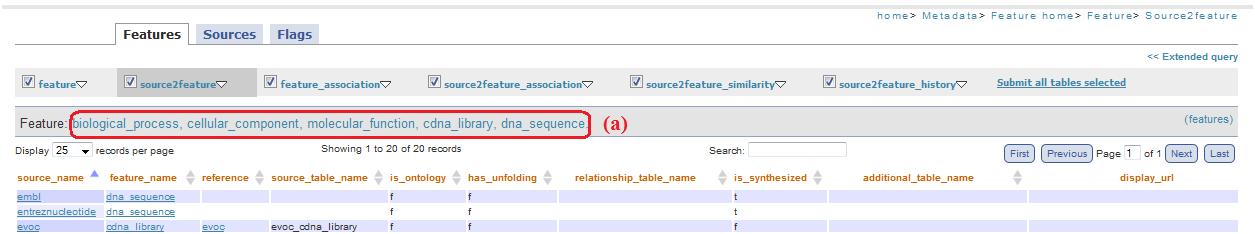
In the field of title in tabs Features, Sources and Flags pages there are shown the feature/source/flags selected (fig 16a).
Fig. 16
When you find a link, it'll redirect you to feature.php, source.php and flag.php page, with its corresponding filtered table (fig. 17a). This happen in source2feature_reationship.php page too: you can see in the title couples of features you have selected in previous pages (feature1 and feature 2).
Fig. 17
In the example figure 18a, clicking on couple of features you are redirected to feature.php page with the table filtered in basis of biological_process, cellular_component, molecular_function, cdna_library, dna_sequence (fig.17a): these are the features previous selected (in feature_relationship.php and source2feature_relationship_feature.php pages).
Fig. 18